Team Chrysler
Manufacturing Dashboard Migration
Currently Chrysler uses a dashboard to track key performance indicators for all of their plants. Managers can review this data to determine if company goals are being met and where improvements need to be made.
However, the current dashboard is a custom-made solution that has grown increasingly difficult to maintain and improve. Our project is to re-design this dashboard using modern methods, particularly Microsoft SharePoint Server, while preserving the functionality of the original. To make the project feasible within a semester, we focused on the Warren Stamping plant.
While the first goal of the dashboard migration is to increase maintainability, the second is improving usability. Currently, the dashboard offers a large variety of reports. Part of our task is to reduce the number of reports while providing the same information via drill down capability. If a particular piece of data presented in a table or chart is interesting to a user, they can click on it and get an expanded view.
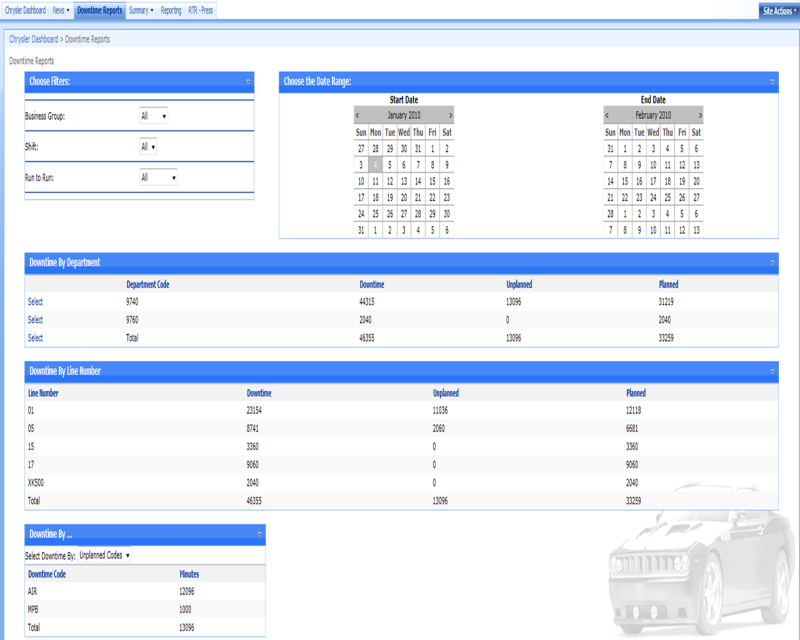
On the right you can see an example page from our dashboard. This page displays downtime for parts of the plant and offers the users several filters for which data is displayed. In addition, when a department and line are selected from the tables at the top, the remaining tables reflect only data for that line.
Along with displaying overall performance data, the site will contain a more advanced news section. This section will display the overall news of the plant, as well as more specific news, such as Financial, Corporate, and Human Resources.

Team Chrysler
Manufacturing Dashboard Migration
MSU Team Members
Alex Walworth, Sturgis, Michigan
Jong Jang, Sterling Heights, Michigan
Ben Pedersen, Lansing, Michigan
Jun Lee, Seoul, South Korea


