![]()
Grand Rapids, Michigan
ITS Scoreboard Dashboard
The Meijer ITS Scorecard Dashboard allows directors and managers within the Information Technology Services department a way to view summarized performance statistics regarding change and incident management.
A change consists of a modification to the current IT infrastructure. An incident refers to an issue that needs to be resolved. The Scorecard Dashboard summarizes key performance statistics regarding changes and incidents, and displays this information to end users through an intuitive graphical interface.
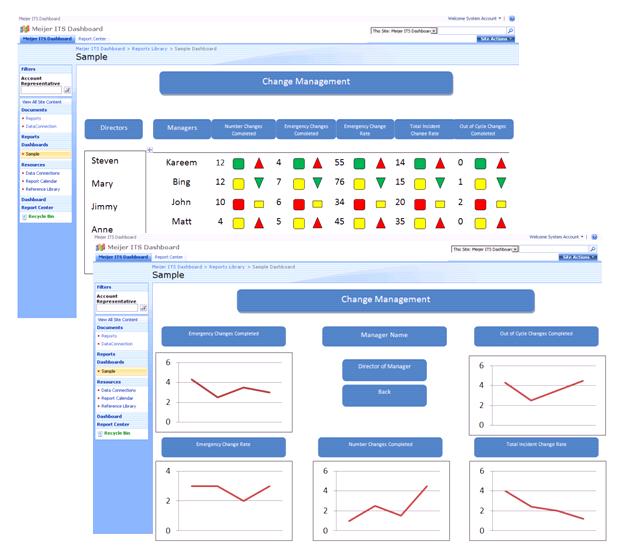
The Scorecard Dashboard utilizes stop-lighting, which allows users to view a manager’s performance through a colored range scheme. Trending is accomplished through arrowed symbols that indicate a manager’s performance over past periods. Charts allow for a visual comparison of statistics among managers that report to a specific director. Users can also drill down to a specific manager and view graphs that summarize performance and efficiency.
The Scorecard Dashboard is integrated with Microsoft Office SharePoint 2007. The capabilities and versatility of SharePoint ensures that the ITS Scorecard Dashboard will provide a useful tool for managers and directors.
The Scorecard Dashboard utilizes SharePoint 2007, ASP.NET and C#. Data is stored in SQL Server 2008.

John Rekoumis, Matthew Wincek, Kareem Janoudi, Bing Shi
![]()
![]()
![]()
![]()
![]()
![]()
![]()
![]()
![]()
![]()
![]()